
QuadGrid: fast spatial data generalization for the best LoD
Last years have seen the rise of data sources with IoT, AoT, mobile devices, beacons, etc. The study of this data can be quite profitable, but there are laws against the use of personal data as is. Or any piece of data that can lead to the identification of an individual. In EU, the General Data Protection Regulation (GDPR)[1] bill will define all the extents of the potential uses of personal data in order to protect the privacy of their citizens. This bill is more detailed and restrictive than previous one, and all the countries in the EU must comply with it starting 25th May 2018.
When talking about privacy, our mind usually slips to financial or medical records, or the kind of content we browse. But another main vector of our privacy is LOCATION. The location vector built up from where and when can easily identify an individual with less than 5 records [2][3]. There are several different approaches for data anonymization, being the K-anonymization [4] the most common, but talking about space-time data needs a different approach, that starts with the definition of a grid in which the data are going to be aggregated.
On the other hand, the location data, matched with demographic and socioeconomic data can be a valuable asset for the companies that produce this kind of massive location data. V. g.: telcos [5], banks [6], insurance companies, SmartCities, etc. Because this kind of data combination can lead to a Real Time Census or Live Census, in which the data of the people living in a place is discarded and the focus is set on the people that are at that certain place at a certain hour.
This Live Census is a new commodity in which lots of traditional and new business are quite interested, and their interest will increase as more and more actors are realizing the value of this information for their operational, tactic and even strategic decisions:
- Retail:
- Identification of passers-by at a their storefront and the distribution in weekdays and hours of the day
- Identify the best place for a new store
- Understand differences in performance of similar-located stores
- Local Government:
- Dimension the public transport based on real potential demand
- Relocate emergency and law enforcement units
- Traffic lights tweaking to reduce the jams
- Choose the best day/hour to perform public works on a certain street
- Power/Gas:
- Module the network flow to fulfil the real demand at every minute at every place
- Marketing
- Best place to locate a billboard [7]
- Dynamically change the content of the billboards based on the audience at every moment
- …
Most of these use-cases requires a high LoD (Level of Detail) in order to be valuable. V.g.: a retail store with a 10m-wide storefront might want to know the information related to the passers-by in an area of ~ 15m x 4m (storefront width plus the max distance for a given field of view, by the width of the sidewalk). And that requirement might collide head on with the privacy law, because such a small area might contain such a small amount of events at a certain moment that could lead to the re-identification of an individual regardless the efforts made to anonymize the data. In the real world, the sidewalk in a shopping area is usually quite crowded, so the amount of events in that area should be high enough to guarantee the anonymity of the passers-by. There are still some corner cases… that, at the end, are the most common cases ![]()
- Areas in the boundaries of the shopping area
- Countryside areas
- Shopping areas out of the opening time
- Residential areas
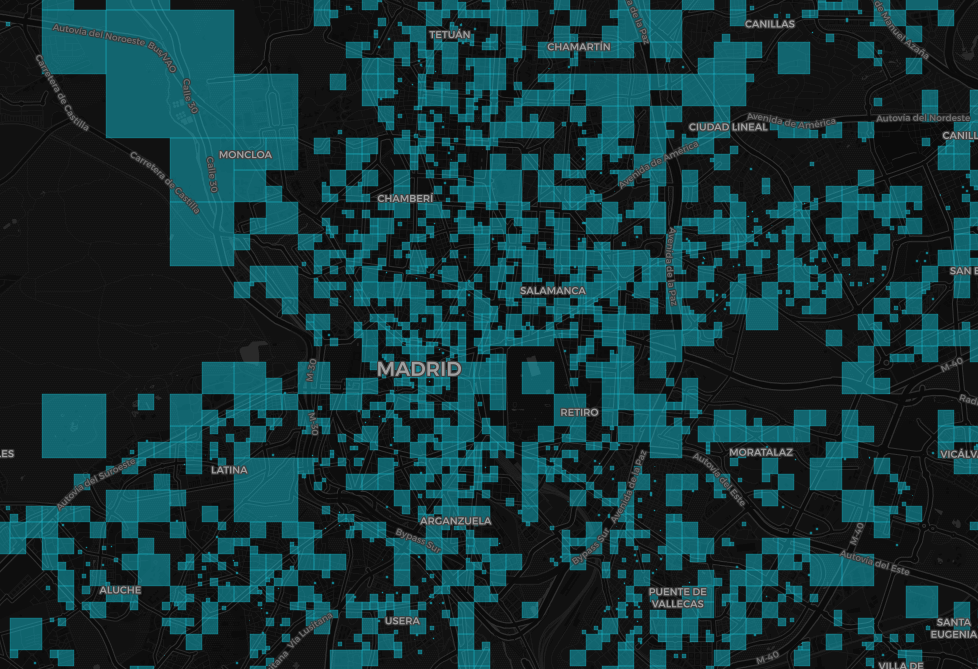
The easy-to-understand example: let’s say that the lawyers state that we need to have at least 25 unique passers-by in my generalized area to be compliant with the law, and if a cell doesn’t meet this requirement, the data within can’t be given to the customer. In the city center, in the most popular shopping street, saturday 6pm to 7pm, you may have 25 unique passers-by in just 1 m² in that timespan. But to have the same amount of passers-by in the suburbs at the same time, you may need a 500m x 500m square. Or the same commercial place, but in the first hour of the morning will also need a bigger cell. And, if you go to the countryside, the cell might be as bigger as a couple of square kilometers. That being said, looks like having an static definition of the grid is absolutely sub-optimal.
So, it looks like the best approach for gridding would be a dynamic and adaptative grid that, being compliant with the restrictions the law may set, gives back the best possible LoD at every place. And the LoD decrease with the size of the cell.
How can this be achieved? Let’s enter the quadtree [8] universe… That’s why I named this approach QuadGrid
- We have a cloud of points (events) with location information and other KPIs and a count threshold of
Nunique passers-by (given by our lawyers) - Let’s define the smallest square that encloses all the points. It will be our cell number 0 (i = 0)
- If
count[i] < N(i=0) the amount of unique passers-by isn’t enough to be compliant, there’s no way to study this dataset - This
potential_cell[i]is compliant, but let’s check whether it has the best possible LoD - Let’s split the
potential_cell[i]in four new square sub-cells - Check the count in each sub-cell
- If none of the subcells’ count is above threshold, the best-LoD-and-law-compliant cell is the parent, and we add it to the resulting grid drop the sub-cells. GO TO: 9.
- If any of the subcells’ count is above threshold, we drop the parent cell and add the compliant sub-cells to the list of potential cells
- Move to next
potential_cell - GO TO: 4
Once we’ve got the idea on how can we grid the data to fulfil our requirements, let’s go get our hands dirty and write some code. I really love the power of SQL to explain algorithms (not a Python guy here) and PostGIS provides all the geospatial functionality needed, so, let’s go.
First of all, some considerations:
- You want your geometry column indexed, believe me. Same applies to your
passer-by ID - You want your dataset clustered [9] by the spatial index above [10]
- As we want
real lifesquare cells, we need to use cartesian-like projection like web mercator [11] - As the data is going to be typically rendered in a web map, and they uses web mercator and a quadtree-based tiling schema [12], why not follow that yellow brick road?
- input geometries in EPSG:3857
- Some thoughts from Javier Santana [13] about recursivity and web mercator [14]…
- And some support functions [15]:
- CDB_XYZ_Resolution(z): Return pixel resolution at the given zoom level
- CDB_XYZ_Extent(x,y,z): Returns a polygon representing the bounding box of a given XYZ tile
So the pl/pgsql function would have a signature like:
- Input:
-
tablenamename of the table storing our point cloud -
geomname of the column of thetablenametable where the events location is stored as points, EPSG:3857 -
uniqueidname of the column of thetablenametable where the passers-by unique identificator is stored -
thresholdlowest value of unique passers-by count
-
- Output: a table with the following columns
-
cell_idcell identifier -
geomgeometry of the resulting cells, EPSG:3857 -
ocurrencesnumber of unique passers-by per cell, for validation purposes only
-
And the function itself…
CREATE OR REPLACE FUNCTION QuadGrid(
    IN tablename regclass,
    IN geom text,
    IN uniqueid text,
    IN threshold integer,
    )
RETURNS TABLE(geom geometry, occurrences bigint)  AS $$
BEGIN
    RETURN QUERY EXECUTE
   'WITH
    RECURSIVE t(pid, id, x, y, z, e) AS (
        SELECT
            '||quote_literal('')||',
            '||quote_literal('0')||',
            0,
            0,
            0,
            count(distinct '||uniqueid||')
        FROM '||tablename||'
        UNION ALL
        SELECT
            t.id,
            t.id ||'||quote_literal('-')||'|| (row_number() over())::text,
            x*2 + xx,
            y*2 + yy,
            z+1,
            (
                SELECT
                    count(distinct '||uniqueid||')
                FROM '||tablename||'
                WHERE ST_Intersects(the_geom_webmercator, CDB_XYZ_Extent(x*2 + xx, y*2 + yy, z+1))
            )
        FROM
            t,
            (VALUES (0, 0), (0, 1), (1, 1), (1, 0)) as c(xx, yy)
        WHERE e >= '||threshold||' AND z < 25
    ),
    potential as(SELECT pid, id, x, y, z, e FROM t WHERE e >= '||threshold||'),
    cleaned as(
        SELECT
            x,
            y,
            z,
            e,
            coalesce(c, 0) as c
        FROM
            potential p1
        left join
            lateral(SELECT count(1) as c FROM potential where pid = p1.id) p2
        ON 1=1
    )
    SELECT
        row_number() over() as cell_id,
        CDB_XYZ_Extent(x, y, z) as geom,
        e as occurrences
    FROM cleaned
    WHERE c = 0;';
END;
$$ language plpgsql IMMUTABLE;
This function is close to O(N), but the final time is quite dependant on how the data is spread and the extent of it.
As an example, this function should be called like
SELECT
    *
FROM
    QuadGrid('my_table', 'my_geom', 'my_client_id', 25);
Once you have built your grid, it’s time to aggregate the value of the KPIs of interest form the points within the resulting cells following the proper aggregation function (count, sum, average, etc.). You may want to make both steps in one shot:
SELECT
    grid.cell_id,
    grid.geom,
    grid.ocurrences,
    avg(e.kpi1) as agg_kpi1,
    sum(e.kpi2) as agg_kpi2,
    max(e.kpi3) as agg_kpi3
FROM
    QuadGrid('my_table', 'my_geom', 'my_client_id', 25) grid
LEFT JOIN
    my_table e
ON
    ST_Within(e.my_geom, grid.geom)
GROUP BY grid.cell_id
But, because of the huge amount of events in the typical input dataset, you may want to materialize the grid in a dataset, and then perform the aggregations later.
Further development on this subject might be found at the project repo [16].
References:
- [1] : GDPR
- [2] : Privacy challenges
- [3] : How hard is it to ‘de-anonymize’ cellphone data?
- [4] : K-anonymity
- [5] : Vodafone Analytics
- [6] : BBVA API Market
- [7] : Using PostGIS for isovists calculation
- [8] : Quadtree
- [9] : PostgreSQL Cluster
- [10] : Improve tile rendering time by clustering during import process @ cartodb-postgresql repo
- [11] : Web Mercator
- [12] : Bing Maps Tile System
- [13] : Javier Santana @ GitHub
- [14] : traversing webmercator quadtree with SQL
- [15] : CDB_XYZ @ cartodb-postgresql repo
- [16] : QuadGrid repo @ GitHub